COVID-19 has been an unprecedented challenge for all businesses.
Some businesses have been consuming more energy and some businesses have been consuming less as they locked down their workplaces. Hence, energy consumption has been reduced for offices by about almost 50% while on the other hand, energy consumption has increased by about 20% in our homes.
We will be lighting up energy consumption trends to show you the effect of COVID-19 on our business as well as investigating how much we could save if we change some of our consumption behaviours. We have pulled some data from the Inavitas Energy-Intelligence Platform that provides real-time energy data to provide savings and to increase energy efficiency for businesses and homes. Inavitas Energy-Intelligence Platform currently monitors more than 5000 supermarkets in different sizes and different regions.
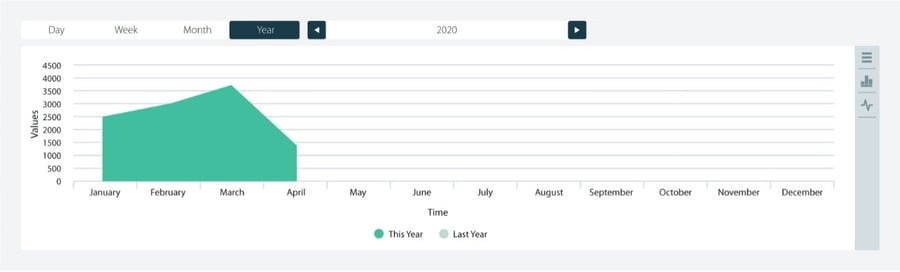
We looked at supermarkets where the population is quite high. In general, when we investigated about more than 50 various supermarkets, we noticed that the energy consumption has increased by an average of 16% and up to 32% in some places since January. This is a very easily noticeable outcome of COVID-19. Some industries worked hard to meet the demand that increased drastically.
When we randomly select any weekday from March, we can see the highest consumption period is between 9am and 8pm.
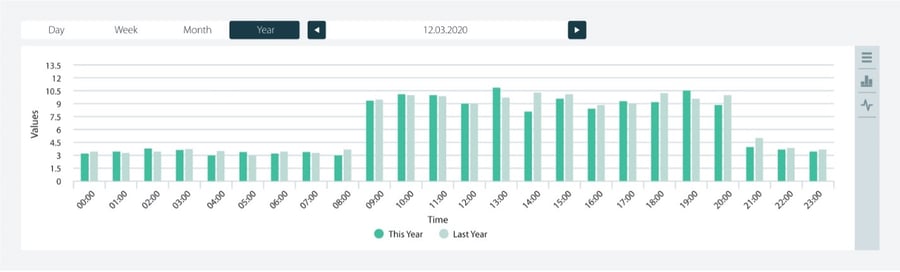
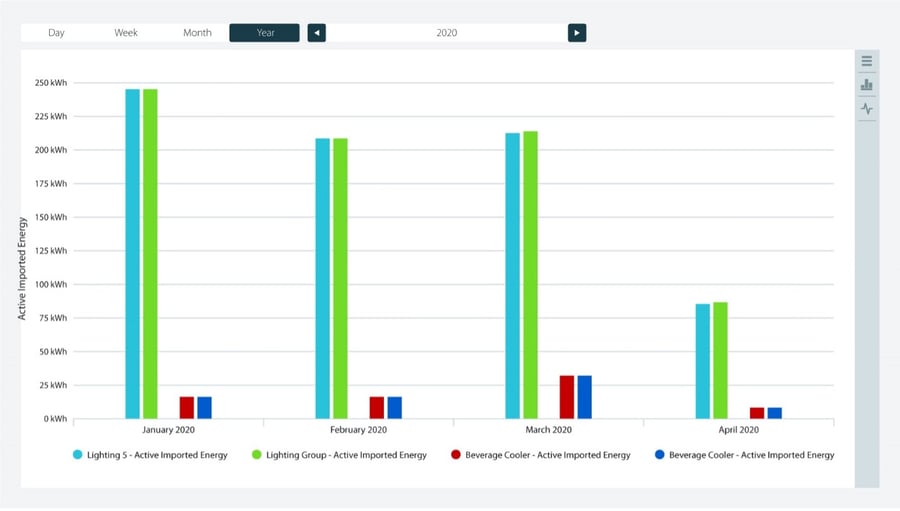
When we focus on loads that suck energy the most during this period, data clearly shows us that energy consumption of lights has risen significantly after COVID-19 which is indicated by the green and blue columns. Besides that, drinks fridge energy consumption has risen to about 12 kWh in March.
However, there is a light still at the end of this tunnel and it's still possible to save on your energy consumption by managing your energy.
How to save energy in the supermarket?
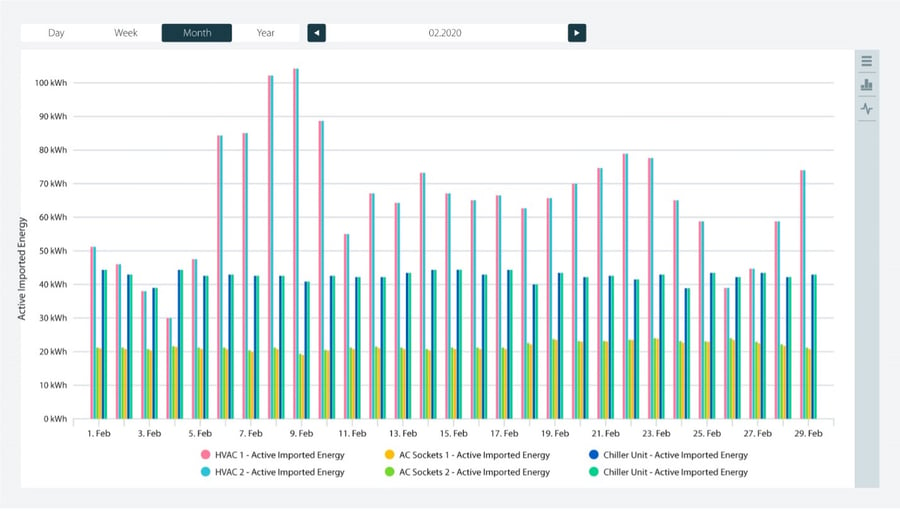
We selected the below case study to show how energy saving is possible with minor changes. In this case, firstly, let’s see what happened in this supermarket and then what actions have been taken, and so what was the result. This graph presents the load distribution of the supermarket without any action that has been taken. The most consuming loads are as listed below:
- Lightings as 70-80% of the total consumption,
- Air Conditioning as 15-20% of the total consumption,
- Fridges as 10-15% of the total consumption,
- Sockets as 5-10% of the total consumption,
This supermarket started using the Inavitas Energy-Intelligence Platform to monitor and manage its energy.
The Results
ACTION 1
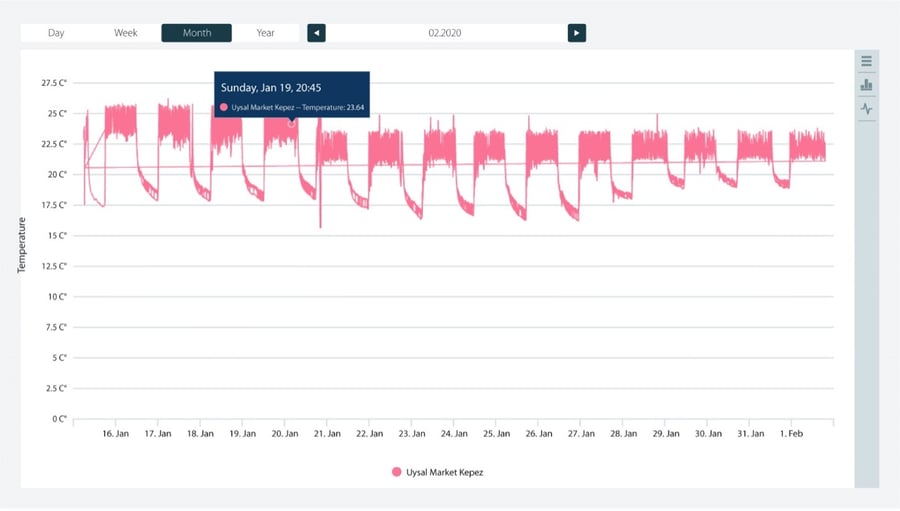
Optimum working temperature of the supermarket has been identified with the help of sensors data, which is between 20°C and 25°C and the temperature has been controlled by the Inavitas Energy-Intelligence Platform to provide more energy savings.
ACTION 2
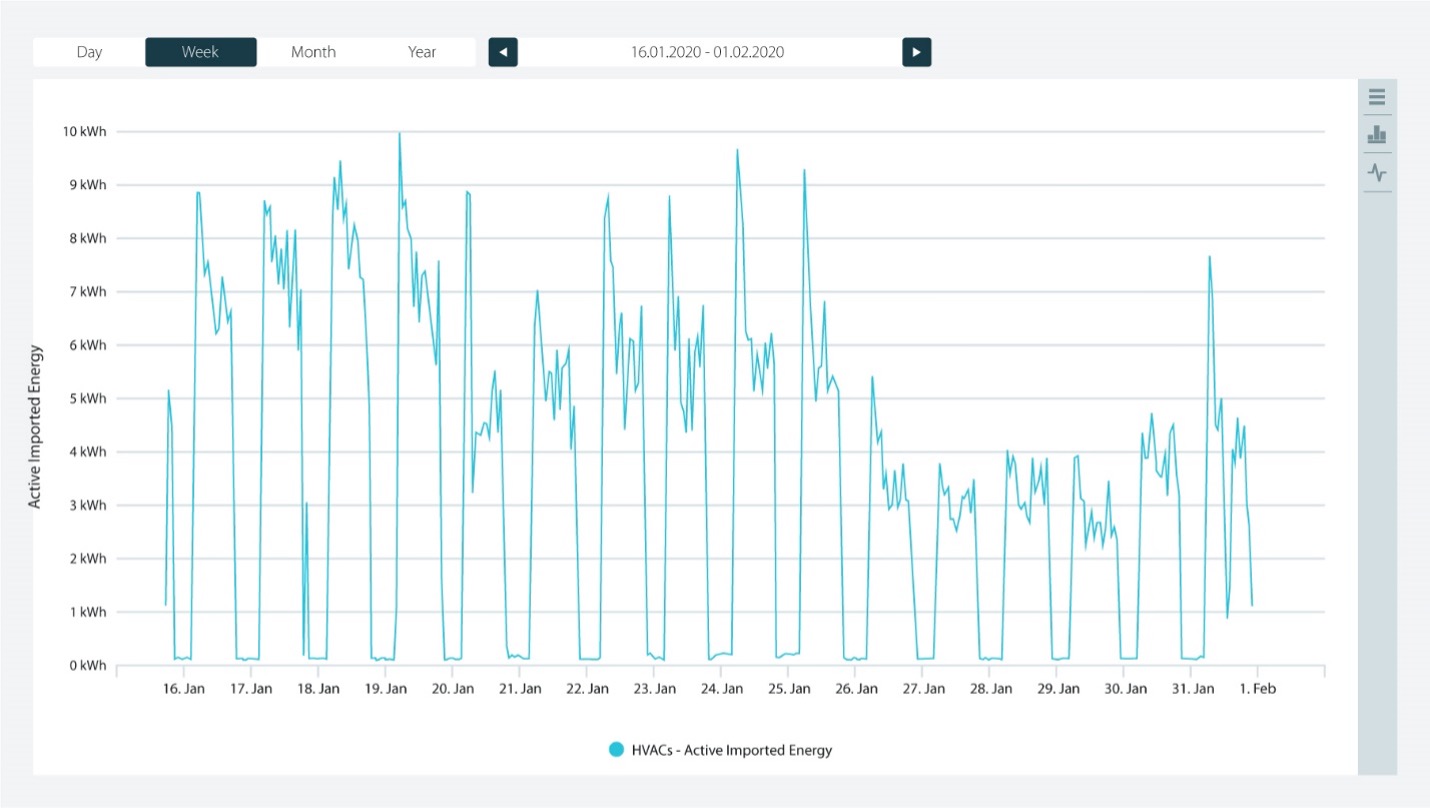
As the below graphs show, HVAC consumption was about 6-7kWh. By controlling HVAC remotely, the consumption of HVAC has been reduced to 0-0.2 kWh after working hours.
Overall, an average of 15% of saving per month has been achieved by monitoring and managing loads in this supermarket.
It is very clear from this example that some businesses have been working hard to cope with the increased demand during this challenging time. But it is possible to save with relatively small adjustments and efficient energy management solutions.
